The 3 Metrics That Actually Matter for Community Bank Marketing
Most community banks track impressions and followers. The three metrics that actually drive growth: cost per account, website conversion rate, and local search share.
A 2025 banking marketing performance study found that only 18% of banks have Google Analytics configured properly. Over half of banks with a CRM use less than 20% of its features. And fewer than one-third have marketing automations running beyond a basic welcome email.
This is not a technology problem. It is a measurement problem. Community banks are spending between 0.05% and 0.07% of assets on marketing — a figure that has barely moved in three years, according to the ABA Bank Marketers Survey — and most of them cannot tell you what that spending actually produces.
The default reporting at most community banks looks something like this: impressions served, social media followers gained, maybe a click-through rate on an email campaign. These are activity metrics. They tell you the marketing department is busy. They tell you nothing about whether marketing is making the bank money.
Here are the three metrics that do.
Metric 1: Cost Per Account Opened
This is the number that connects your marketing budget to your balance sheet. Cost per account opened (CPAO) measures exactly what it sounds like: how much you spend in marketing to generate one new account.
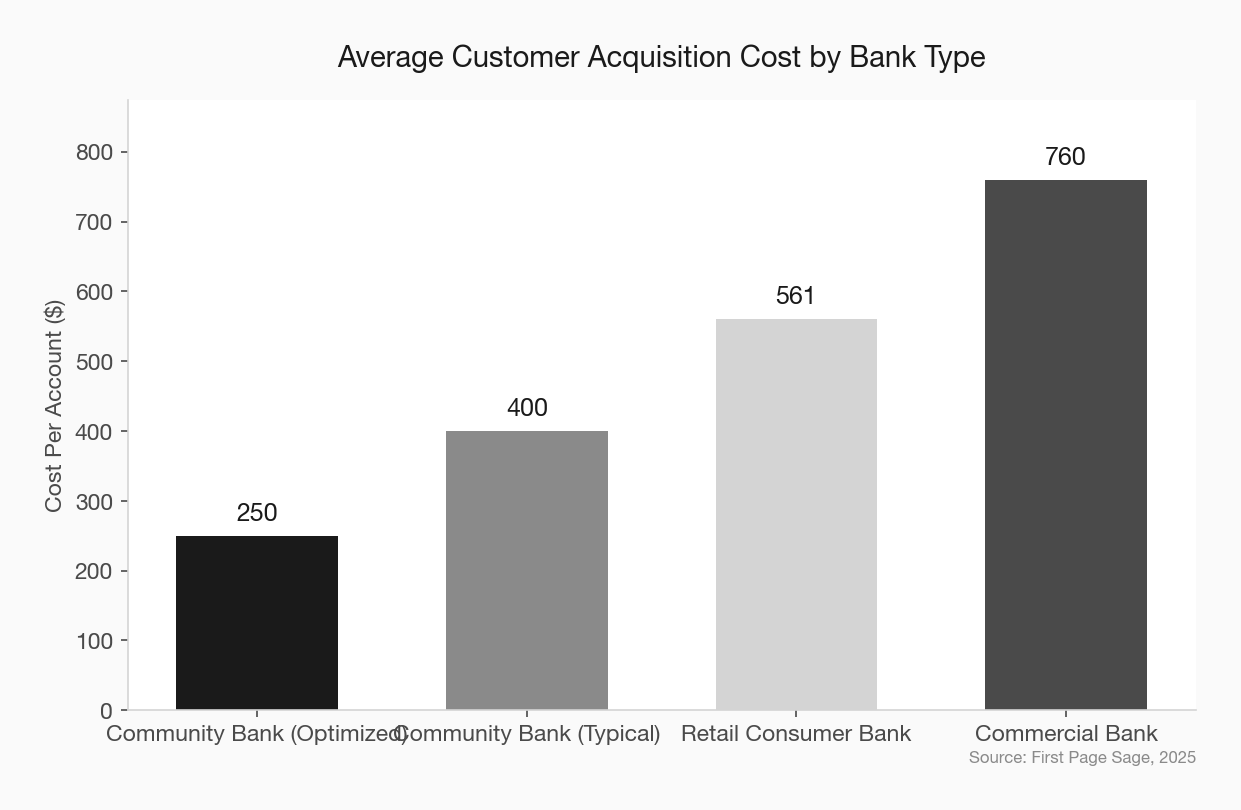
The industry data is instructive. According to First Page Sage, the average customer acquisition cost for a retail consumer bank runs around $561. For community banks specifically, acquiring a new checking account customer typically costs between $200 and $400, with well-optimized programs pushing below $250.
Most community banks cannot produce this number. They know what they spent on the spring checking campaign and they know how many accounts opened that quarter, but they cannot draw a line between the two.
How to Calculate It
Start simple. Take your total marketing spend for a quarter and divide it by the number of new accounts opened in that period. That gives you a blended CPAO. It is imperfect, but it is infinitely better than reporting impressions.
The next step is channel-level attribution. If you spent $15,000 on Google Ads and can attribute 40 new checking accounts to those campaigns, your paid search CPAO is $375. If your community sponsorship program cost $8,000 and you can trace 10 new accounts to those events, that channel runs $800 per account.
This is where the conversation shifts from “how much should we spend on marketing” to “where should we spend it.” community bank marketing budget strategy
What Good Looks Like
For a community bank, a blended CPAO under $300 is strong. Under $200 is excellent. The key is not hitting a specific number — it is tracking the trend. If your CPAO is rising quarter over quarter, something in your funnel is broken. If it is falling, your optimization is working.
The real power of CPAO is in the board room. When your CEO asks what marketing did last quarter, “we opened 200 accounts at $275 each” is a fundamentally different answer than “we got 50,000 impressions.”
Metric 2: Website-to-Application Conversion Rate
Your website is the front door to your bank for the majority of prospective customers. Research from Bankrate shows that 77% of consumers prefer to manage their bank accounts through digital channels. More critically, 82% of financial institutions now offer online account opening — which means the experience of your website is a direct competitive factor.
The problem is that most community bank websites convert terribly.
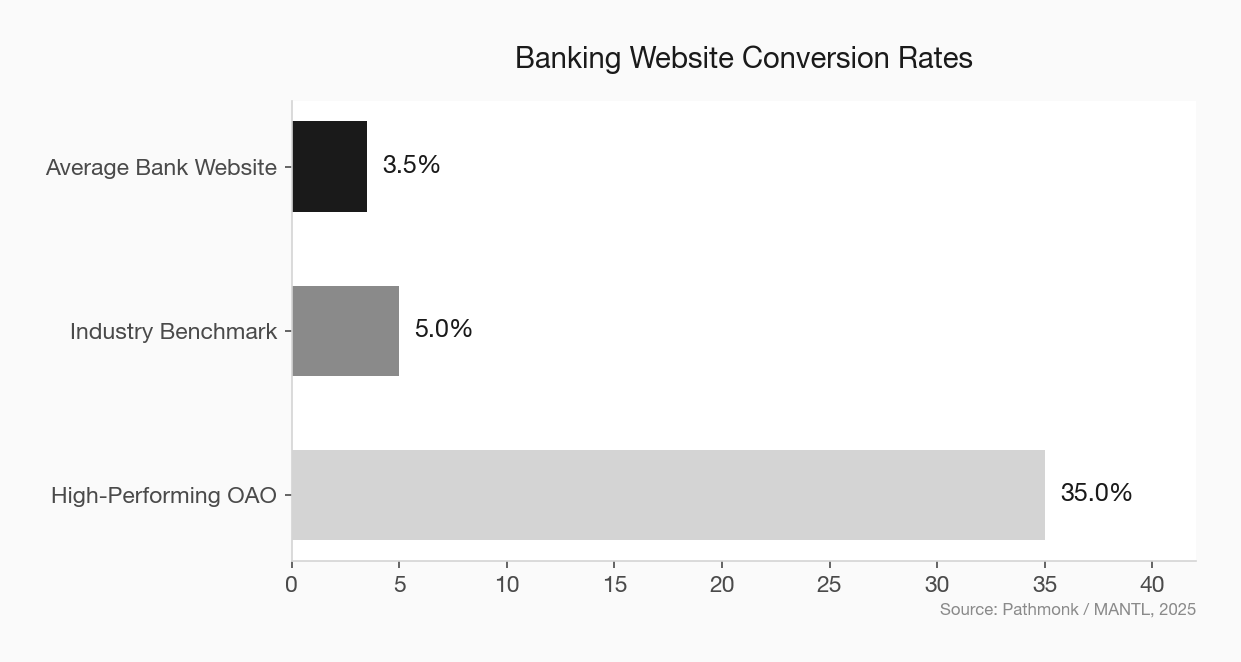
The average conversion rate for banking websites sits between 2% and 5%, according to Pathmonk’s analysis of financial services conversion data. But here is where it gets interesting: high-performing online account opening solutions convert at 30% to 40%, with submission rates hitting 55% and approval rates at 65%.
The gap between average and high-performing is enormous. And the culprit is almost always friction. MANTL’s research found that every 10 seconds added to the application process correlates with roughly a 5% increase in abandonment. If your online account opening takes more than 10 minutes, you are losing up to 40% of applicants.
What to Measure
Track two numbers: the percentage of website visitors who start an account application, and the percentage of those who complete it. The first tells you whether your site is compelling. The second tells you whether your process works.
Most community bank websites are built for compliance, not conversion. They have the disclosures, the rate tables, the branch locator — and none of the urgency, clarity, or simplicity that turns a visitor into an applicant. bank website conversion optimization
The Fix Is Not Expensive
You do not need a full redesign. Start with the account opening page. Remove every unnecessary field from the application. Make the call to action visible above the fold. Test one change per month and measure the result.
One case study documented in The Financial Brand showed that small, data-driven changes to a digital application process improved loan conversions from 36% to 50% over just five weeks — a 39% improvement with no major technology investment. digital account opening best practices
Metric 3: Share of Local Search
This is the metric that most community banks are not tracking at all, and it might be the most important of the three.
Nearly half of all Google searches have local intent. Mobile queries for “bank near me” have grown over 60% in the past two years. When someone in your market searches for a checking account, a mortgage rate, or a business loan, the results they see are determined by local search algorithms — and your community bank is either showing up or it is not.
Share of local search measures how often your bank appears in local search results relative to competitors in your market. It is the digital equivalent of share of voice, and it directly predicts foot traffic and new account generation.
The Google Business Profile Is Ground Zero
The cornerstone of local search visibility is your Google Business Profile. A complete, accurate, and actively managed profile is what gets your bank into the local map pack — the three results that appear above organic listings when someone searches with local intent.
Most community banks have a Google Business Profile. Very few are managing it. That means outdated hours, no photos, no recent reviews, and no posts. Meanwhile, the megabank branch down the street has a profile with 200 reviews, weekly posts, and photos of their recently renovated lobby.
How to Track It
Google Business Profile Insights gives you the basics: how many people saw your profile, how many clicked for directions, how many called. But share of local search requires competitive context.
Use a local SEO tracking tool to monitor where you rank for your top 10-15 keywords in your market: “checking account [city name],” “business loan [county],” “bank near me.” Track your position weekly. If you are not in the top three local results for your primary market, you are invisible to a growing segment of potential customers. community bank SEO strategy
The Compounding Effect
Local search is a compounding asset. Every Google review you collect, every profile update you post, every local keyword you rank for makes the next one easier. Banks that invest consistently in local search optimization see traffic gains that accelerate over time, not diminish.
The ABA’s data shows that search engine marketing and optimization emerged as the clear frontrunner for strongest marketing returns in 2025, with banks reporting it as the most cost-effective and measurable channel. That is not a coincidence. Search captures demand at the exact moment of intent. bank marketing channel ROI
Why These Three — And Not Others
These three metrics share a common trait: they connect marketing activity to business outcomes. CPAO ties spending to growth. Website conversion ties your digital presence to applications. Local search share ties your visibility to the market you serve.
Compare that to what most community banks report: impressions, followers, email open rates. Those are inputs. The three metrics above are outputs. Inputs tell you marketing is happening. Outputs tell you marketing is working.
The 2025 banking marketing performance study from Richardson Marketing found that marketing automation was the biggest missed opportunity across the industry. Less than a third of banks had active automations beyond welcome emails. That matters because automation is what bridges the gap between these metrics — it is what turns a local search click into a website visit into an account application into a measurable cost per acquisition.
Getting Started This Quarter
You do not need a data science team to start tracking these metrics. Here is a 30-day plan:
Week 1: Calculate your blended CPAO for last quarter. Total marketing spend divided by total new accounts. Write the number down.
Week 2: Install or verify Google Analytics on your website. Set up conversion tracking for your account opening page. Measure your current website-to-application rate.
Week 3: Audit your Google Business Profile for every branch. Update hours, add photos, respond to reviews. Check your ranking for five core local search terms.
Week 4: Build a one-page dashboard with all three metrics. Present it to your leadership team. community bank marketing dashboard
The banks that are growing fastest right now are not the ones with the biggest marketing budgets. They are the ones that know what their marketing produces — and can prove it.